Guide to using the Portfolio Insight tools for making data-driven decisions.
Portfolio Overview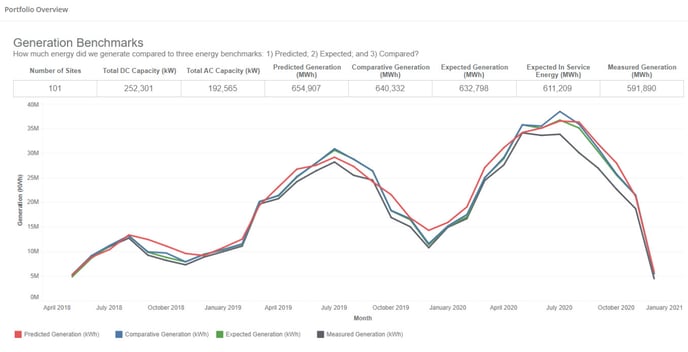
This is the "forest" view of your portfolio. Review this every month.
- Size
- Cumulative energy benchmarks
- Monthly energy benchmarks
Denowatts utilizes IEC 61724-1 definitions for Predicted and Expected Energy. In summary, "Predicted" Energy is the amount of energy estimated by your Energy Model using historic weather data. "Expected" Energy is the amount of energy estimated by your Energy Model using measured weather conditions and adjusted for age.
Comparative Energy is a performance benchmark developed by Denowatts. Comparative Energy is analogous to Expected Energy, however using Denowatts defined electrical characteristics to model energy output. The Comparative Energy defined electrical characteristics include your Site's actual DC and AC system capacities along with a Denowatts standardized derating formula and temperature coefficient. This standardization enables a common benchmark across all Denowatts Sites for measuring comparative performance.
How many sites are included in our portfolio? What is the aggregate capacity?
How much energy did we generate compared to three benchmarks: 1) Predicted; 2) Expected, and 3) Compared?
Portfolio Generation and Losses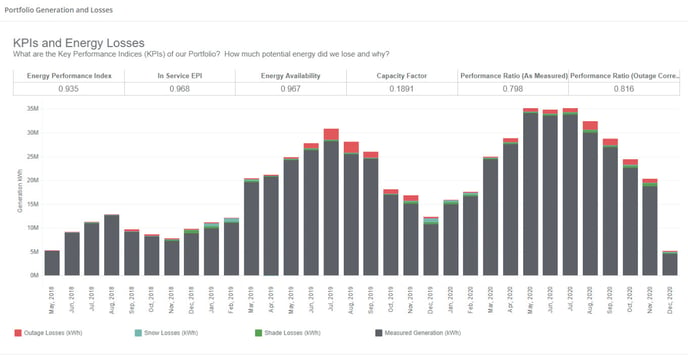
This view begins the descent into the forest. This monthly view shows:
- Key Performance Indices (KPIs)
- Monthly generation and losses
KPI Summary
Energy Performance Index (EPI): The Measured Generation divided by the Expected Energy. Expected Energy includes outage losses but excludes shade and snow losses.
In-Service EPI: The Measured Generation divided by the In Service Expected Energy (fully available).
Energy Availability: The EPI divided by In Service EPI.
Capacity Factor: Measured Energy divided by DC capacity and hours in the reporting period.
Performance Ratio: The ratio of Effective Plane of Array (POA) Irradiation that is converted to Grid Energy.
What are the KPIs of our portfolio?
How much potential energy did we lose and why?
Portfolio Losses Detail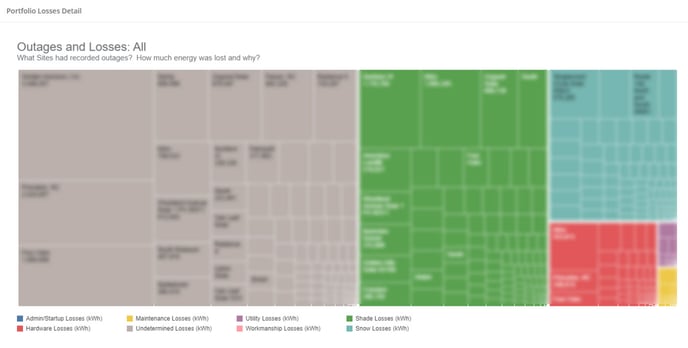
We're now in the forest hunting for the missing photons. This tree chart view shows detailed losses by type:
- Outages
- Shade
- Snow
Denowatts utilizes algorithms and human review to detect and verify periods of under performance. These periods are grouped by Array as "Outages" and "Losses". Outages are defined by system non-availability, while Losses are due to external factors such as shade and snow. Denowatts initially flags Outages as "Undetermined" and awaits user characterization of the root cause of the event.
The value of energy lost during the outage is derived from Denowatts Learned Energy. Learned Energy is a Denowatts benchmark of the Site's typical operating profile from a defined baseline period. Simply put, Learned Energy answer's the question: "Is the array working as normal?"
What sites had recorded outages?
How much energy was lost and why?
Site Triage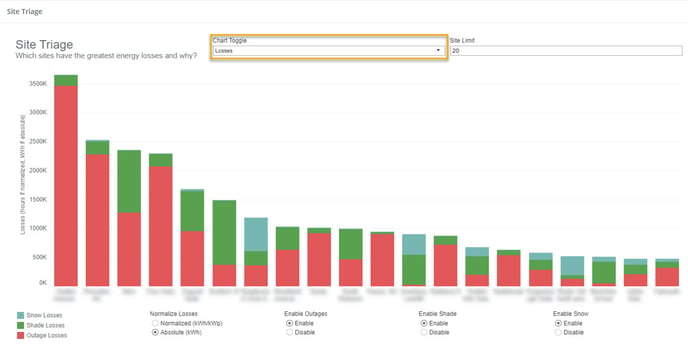
This view shows the sites that need the most attention.
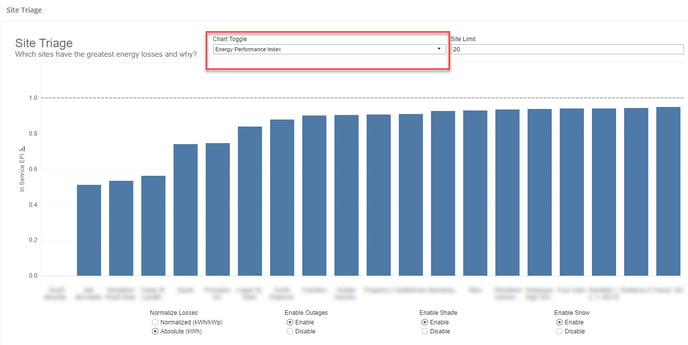
What is the cost of losses by site?
Which sites need the most attention?