Measurement senstivity and conditions that lead to increased error in winter capacity testing periods
December 31st marks a key date in the life of many solar projects due to project financing and tax compliance requirements. Project closing will typically require a capacity test, a multi-day report of expected power performance, that may inevitably occur close to the winter solstice. EPCs and Owners should understand and plan to mitigate common testing error that results during this period. In summary, winter testing sources of error are magnified, and test periods are longer.
Testing error that in summertime months could be 3%-4% (k=2) can become a multiple during the months on either side of the winter solstice. Further, the allowed test points that are required for a capacity test will likely be reduced due to the shorter days and filtering of lower irradiance levels, increased shading, and soiling from snow. The result is winter test periods that are considerably longer than those administered during summer months.
Location and project characteristics weigh heavily on error and test periods. Consider the following examples that demonstrate the sensitivity of test measurement and conditions unique to this time of the year:
Irradiance Levels. Peak irradiance levels incident to the array on low-tilt or northern projects may be cut in half. A measurement error of 10 W/m2 during a peak 1,000 w/m2 day in the summer (1% error) will double on a peak 500 W/m2 day in the winter (2% error). This doubling in error may seem obvious, but it is a simple way to demonstrate the impact of a reasonably good irradiance measurement error.
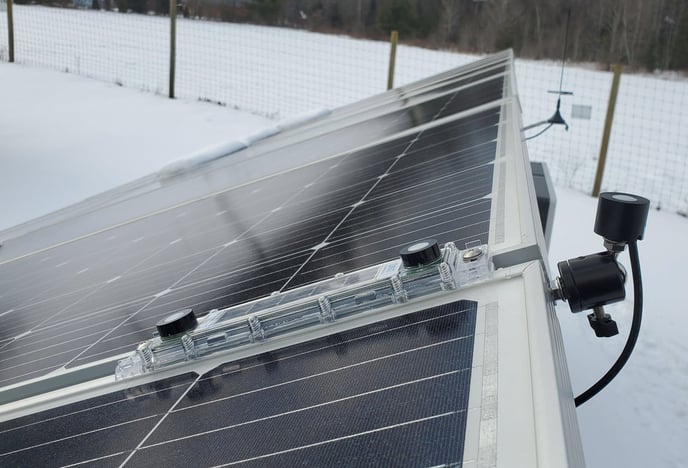
Incident Angle. Measurement error owing to the misalignment of the array power and the benchmark is amplified greatly during the winter months. For example, take a 1o tilt error in the benchmark of a single-axis tracker in a northern latitude that has mid-day incidence angle of 15o in the summertime and 65o in the wintertime. If a 1o benchmarking alignment error results in actual angles 14o and 64o, respectively, the result is a relatively negligible 0.4% error on a sunny day in the summer but a much more significant 3.4% error in the winter. For reference, “<1o from POA” is a typical pyranometer mounting specification tolerance. A close benchmark alignment on a homogenous planar array is reasonably attained with careful installation. However, a heterogeneous array that follows a contoured ground surface may require multiple benchmarking sensors to minimize alignment error.
Near Shade. Shade modeling is part of building the predicted energy model. Near shading from surrounding trees, structures, and other modules is based on approximations in the design. Actual conditions can vary the results such as shading from a stand-alone larger tree or utility pole, or topographical variation that was not properly modeled. These impacts from shading are amplified as the zenith angle lowers during the winter months. Since capacity testing must filter out any shaded periods, careful analysis must identify and remove impacted data points.
Snow. While soiling is a condition that may be inevitable on any installation, snow will bring capacity testing to a halt. Snow takes many forms and its impact on solar performance varies, so careful analysis to identify when it occurs and when its effects cease is critical. Module tilt angle, temperature, and irradiance levels primarily impact how long a snow event will degrade performance. Snow eventually clears by melting or sliding of the modules, though patches may linger at module edges and result in continued degraded performance.